Polar, every 15°
13 rings 1/4 inch apart
Concentric rings and angle lines every 5, 10, 15 or 30 degrees, labeled around the edge. Pick the ring spacing, then download a true-size PDF.
Four angle spacings and two class sheets. PDF prints Letter; the second button prints A4.
13 rings 1/4 inch apart
17 rings, 72 angle lines
8 rings, 36 angle lines
6 rings for first lessons
For homework and handouts
Copies cleanly for a class
Polar graph paper swaps the square grid for rings and angle lines, so you can plot by distance and direction instead of x and y. The degrees are printed around the edge and the main axes are darker, which makes plotting from a table quick.
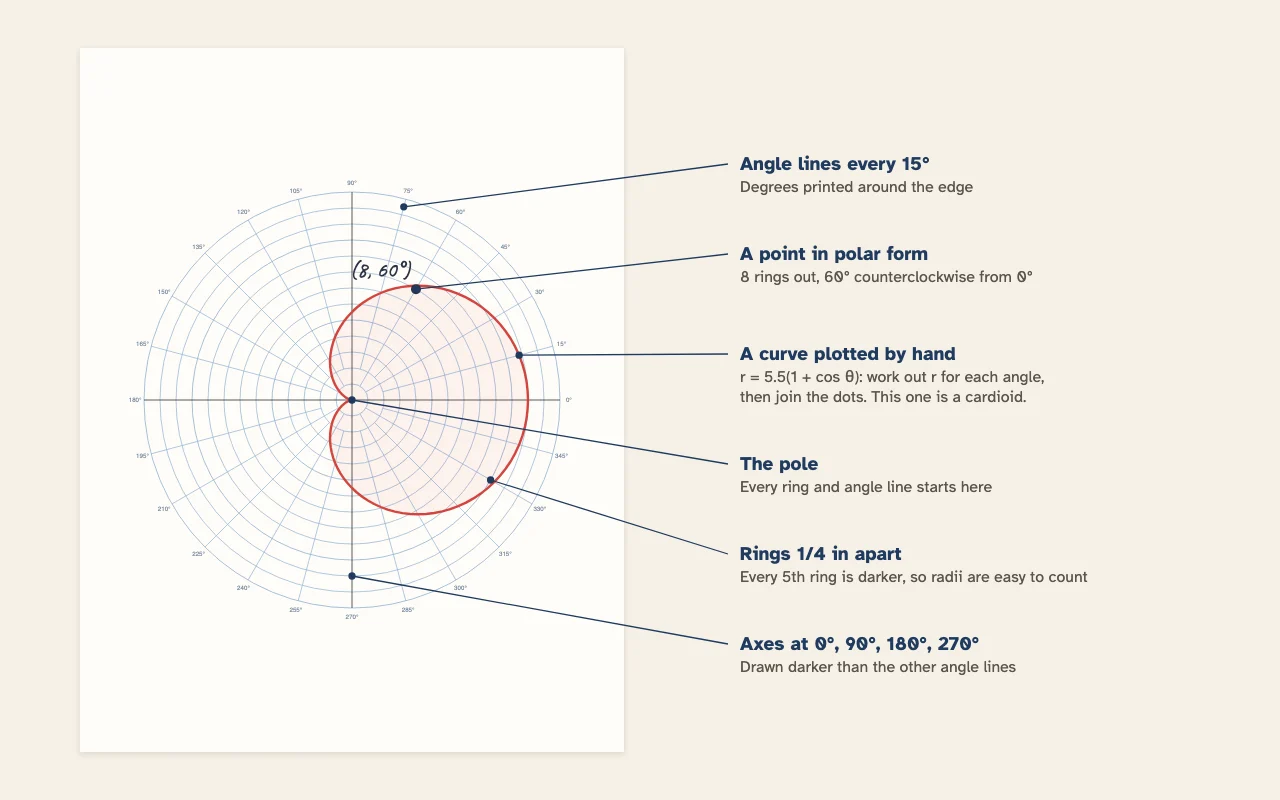
The center of the sheet is the pole. Each ring is one unit further out, and each straight line is an angle measured counterclockwise from the 0 degree line on the right. A point is written as (r, θ): go out r rings along the θ line.
| Ring spacing | Rings on Letter | Rings on A4 | Circle across | Good for |
|---|---|---|---|---|
| 5 mm | 17 | 16 | 17 cm | Smooth curves and fine detail |
| 1/4 in · 6.35 mm | 13 | 13 | 6.5 in | Most homework; the default |
| 10 mm · 1 cm | 8 | 8 | 16 cm | Large plots and class handouts |
| 1/2 in · 12.7 mm | 6 | 6 | 6 in | First lessons and board work |
Every fifth ring and the outermost ring are drawn darker, so you can count to 10 or 13 without losing your place. Short angle lines stop a few rings from the center to keep the middle readable; the 30 degree lines start at the first ring and the four axes run all the way to the pole.
For a single point, find the angle, then count out. (4, 135°) is four rings along the 135 degree line, up and to the left. (−4, 135°) is four rings the other way, on the 315 degree line.
For a curve, work from a table:
Curves that look hard in x and y are simple here. A circle around the pole is just r = 5. A straight line through the pole is θ = 60°. A spiral, r = θ, grows by the same amount on each turn.
| Curve | Equation | What you see |
|---|---|---|
| Circle | r = a | A ring a units from the pole |
| Cardioid | r = a(1 + cos θ) | A heart shape with its point at the pole |
| Limaçon | r = a + b·cos θ | A dimpled loop, or a loop inside a loop when b > a |
| Rose | r = a·cos(nθ) | n petals when n is odd, 2n when n is even |
| Lemniscate | r² = a²·cos(2θ) | A figure eight through the pole |
| Spiral | r = aθ | Rings that open out evenly |
Rose curves are a good test of the angle spacing: a four-petal rose, r = cos(2θ), has a petal tip every 90 degrees and passes through the pole at 45, 135, 225 and 315 degrees, so 15 degree lines catch every key point.
For x and y graphs, the Coordinate card on the graph paper page prints a grid with numbered axes. For circles in 3D drawings, isometric paper is the better fit.
Polar graph paper is a grid of evenly spaced circles around a center point, crossed by straight lines through the center at equal angles. You plot a point by its distance from the center, r, and its angle from the 0 degree line, θ, instead of by x and y.
Find the angle first: start on the 0 degree line on the right and turn counterclockwise to the angle line you need. Then count rings out from the center along that line. The point (8, 60°) is eight rings out on the 60 degree line. For a negative r, go the same distance in the opposite direction.
With rings 1/4 inch apart, a Letter or A4 sheet holds 13 rings, and every fifth ring is darker. Angle lines can be every 5 degrees (72 lines), 10 degrees (36), 15 degrees (24) or 30 degrees (12). The 0, 90, 180 and 270 degree axes are always drawn darker.
The edge is labeled in degrees. With angle lines every 15 or 30 degrees, each line is also a common radian value: 30° is π/6, 45° is π/4, 60° is π/3 and 90° is π/2. Write the radian labels in pencil if your class uses them.
Use 15 degrees for most precalculus homework, since it lands on 30, 45 and 60 degrees. Use 30 degrees for a first lesson, when fewer lines are easier to read. Use 5 or 10 degrees for plotting a curve from a table of values, where more angles give a smoother shape.
Make a table of θ and r, using the angles on your sheet. For r = 5.5(1 + cos θ), r is 11 at 0°, 5.5 at 90° and 0 at 180°. Plot each pair, then join them with a smooth curve. That one is a cardioid; r = a·cos(3θ) gives a three-petal rose.
You can, but note that math angles start on the right and turn counterclockwise, while compass bearings start at north and turn clockwise. Write N at the 90 degree mark and read the angle the other way round, or label your own bearings in pencil.
Yes. Turn on Name and date line, or use the With name card. The circle moves down to make room, and Title on the page prints at the top, which is handy for writing the equation you are graphing.
Yes. Print it for homework or copy it for a class without signing up, and put up to 100 identical sheets in one PDF. It is drawn as vectors, so circles stay smooth on any printer.